
Fund Manager
Anthropic Quarterly Revenue: 30x in 15 Months (S-1)
Anthropic Quarterly Revenue: 30x in 15 Months (S-1)
Addhyan Negi
·
Short answer: Anthropic's S-1 reports quarterly revenue of $376 million in Q1 2025 and $11,555 million in Q2 2026, about 30.7 times higher in five quarters. Revenue per dollar of compute expense rose from $0.40 to $2.08 over the same period. Anthropic reported a GAAP operating income of $974 million in Q2 2026, but a six-month operating loss of $693 million and a net loss of $66.3 billion for the quarter.
Anthropic, PBC filed its Form S-1 with the SEC on October 26, 2026 (accession 0001628280-26-067168). It is a preliminary prospectus marked “subject to completion,” and the price range and share count are blank. Every figure below comes from that filing, with S-1 page numbers in parentheses. Where a number is our own arithmetic on the filing's numbers, we say so. You can read the filing yourself on SEC EDGAR.
For the IPO process, see our IPO timeline. This piece stays on the financials.
Anthropic quarterly revenue: $376M to $11,555M
The filing's quarterly results table (p. 158) gives six quarters. Quarterly figures in the S-1 are unaudited.

Source: Anthropic S-1 (SEC filing, accession 0001628280-26-067168), pp. 137 and 158; quarterly figures are unaudited; multiples are our calculation; chart by Allocations
Quarter | Revenue ($M) | Growth vs prior quarter |
|---|---|---|
Q1 2025 | 376 | n/a |
Q2 2025 | 787 | 2.1x |
Q3 2025 | 1,382 | 1.8x |
Q4 2025 | 2,040 | 1.5x |
Q1 2026 | 4,731 | 2.3x |
Q2 2026 | 11,555 | 2.4x |
Growth multiples are our calculation (for example 11,555 / 4,731 = 2.44). The four 2025 quarters add up to $4,585 million, which matches the 2025 annual revenue in the filing (p. 23). Annual revenue was $41 million in 2023 and $386 million in 2024 (p. 23).
Operating expenses grew much more slowly than revenue. Total operating expenses were $1,311 million in Q1 2025 and $10,581 million in Q2 2026 (p. 158), up about 8.1 times (10,581 / 1,311) against 30.7 times for revenue. Revenue minus operating expenses is operating income, so that gap is what moved the operating line from a $1,667 million loss in Q1 2026 to a $974 million gain in Q2 2026.
The 30x claim, with the arithmetic
Q1 2025 to Q2 2026 is five quarters, or 15 months. $11,555M / $376M = 30.7. So “about 30x in 15 months” holds, and it is slightly conservative. Year over year, Q2 2026 revenue is 11,555 / 787 = 14.7 times Q2 2025, which the filing describes as a 1,368% increase (p. 11).
The “every 3 days” claim
Q2 2026 has 91 days (30 in April, 31 in May, 30 in June). $11,555M / 91 = about $127M per day. Three days is about $381M, within 1.3% of Q1 2025's full-quarter revenue of $376M. The claim holds as a rounded comparison. It is a derived figure, not a statement in the filing.
Revenue per dollar of compute: $0.40 to $2.08
Compute and infrastructure is the largest expense line in the filing. Dividing quarterly revenue by that line gives a rough efficiency ratio. The S-1 does not publish this ratio; the table below is our calculation from p. 158.
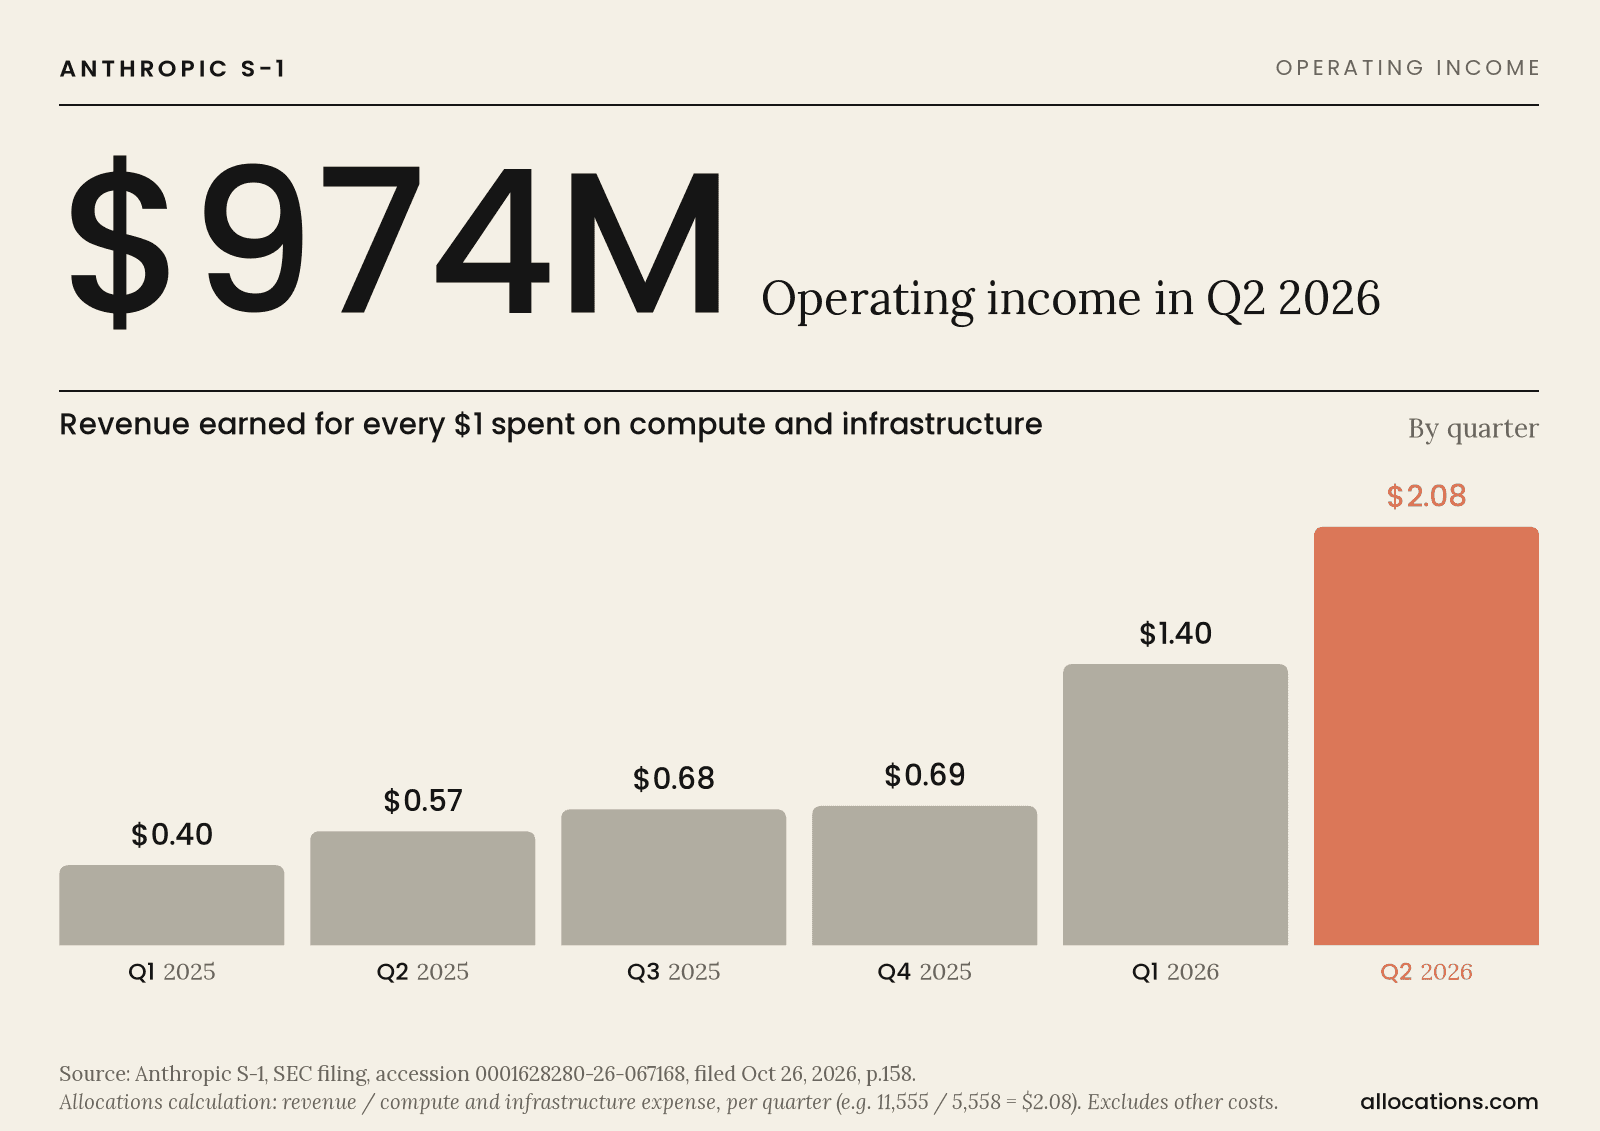
Source: Anthropic S-1 (SEC filing, accession 0001628280-26-067168), p. 158; the ratio is our calculation (revenue divided by compute and infrastructure expense) and excludes other costs; chart by Allocations
Quarter | Revenue ($M) | Compute & infrastructure ($M) | Revenue per $1 of compute |
|---|---|---|---|
Q1 2025 | 376 | 944 | $0.40 |
Q2 2025 | 787 | 1,390 | $0.57 |
Q3 2025 | 1,382 | 2,047 | $0.68 |
Q4 2025 | 2,040 | 2,945 | $0.69 |
Q1 2026 | 4,731 | 3,387 | $1.40 |
Q2 2026 | 11,555 | 5,558 | $2.08 |
$2.08 / $0.40 = 5.2, so “more than 5x” holds. In Q2 2026, revenue grew 1,368% year over year while compute and infrastructure expense grew about 300% (pp. 11, 137).
Read this ratio with care. It leaves out personnel, sales, research and other costs, so it is not a gross margin. The company also warns that new compute is expensed as it comes online, often ahead of the revenue it will support, and that operating margin may compress in those periods (p. 134). One strong quarter does not make a trend line.
Is Anthropic profitable? Operating income vs net loss
Both of these are true in the filing: Anthropic had a positive GAAP operating income in Q2 2026, and it had a large net loss in the same quarter. They measure different things.

Source: Anthropic S-1 (SEC filing, accession 0001628280-26-067168), p. 158 (quarterly, unaudited); chart by Allocations
Metric ($M) | Q2 2026 | Six months ended June 30, 2026 |
|---|---|---|
Revenue | 11,555 | 16,286 |
Operating income (loss) | 974 | (693) |
Change in fair value of notes, derivatives and SAFEs | (59,597) | (72,388) |
Net loss | (66,309) | (80,748) |
Sources: quarterly table p. 158; six-month figures pp. 23 and 148. Q2 2026 operating income of $974M on $11,555M of revenue is an operating margin of 8.4% (our calculation).
The gap between operating income and net loss is mostly one line. The filing records its convertible notes, derivative liabilities and SAFEs at fair value each period. Because they are marked to market, increases in the company's enterprise valuation drive increases in this expense (p. 147). It is an accounting remeasurement, separate from running costs.
Two more numbers matter for the profitability question. The filing's non-GAAP Adjusted Operating Income, which excludes stock-based compensation, non-cash charitable contributions and the Bartz settlement, was $1,618 million for the six months, a 10% margin (pp. 25, 156–157). Operating cash flow for the six months was positive $3.9 billion (p. 169). So the accurate summary is: operating income positive in one quarter, negative over the half year, net loss in every period shown.
The Bartz settlement was $1.5 billion and sits in Q3 2025, which is why that quarter's operating loss of $3,089 million stands out in the table.
Net revenue retention and $100K+ customers
The filing reports net revenue retention of approximately 900% as of September 30, 2026 (p. 11). The definition is narrow: it compares current-quarter revenue from customers who generated at least $1 in the base period a year earlier, and it excludes Pro and Max subscribers (p. 3). A very low starting threshold and a small early base make a number like this large. Treat it as a measure of expansion among that cohort, not of the whole business.
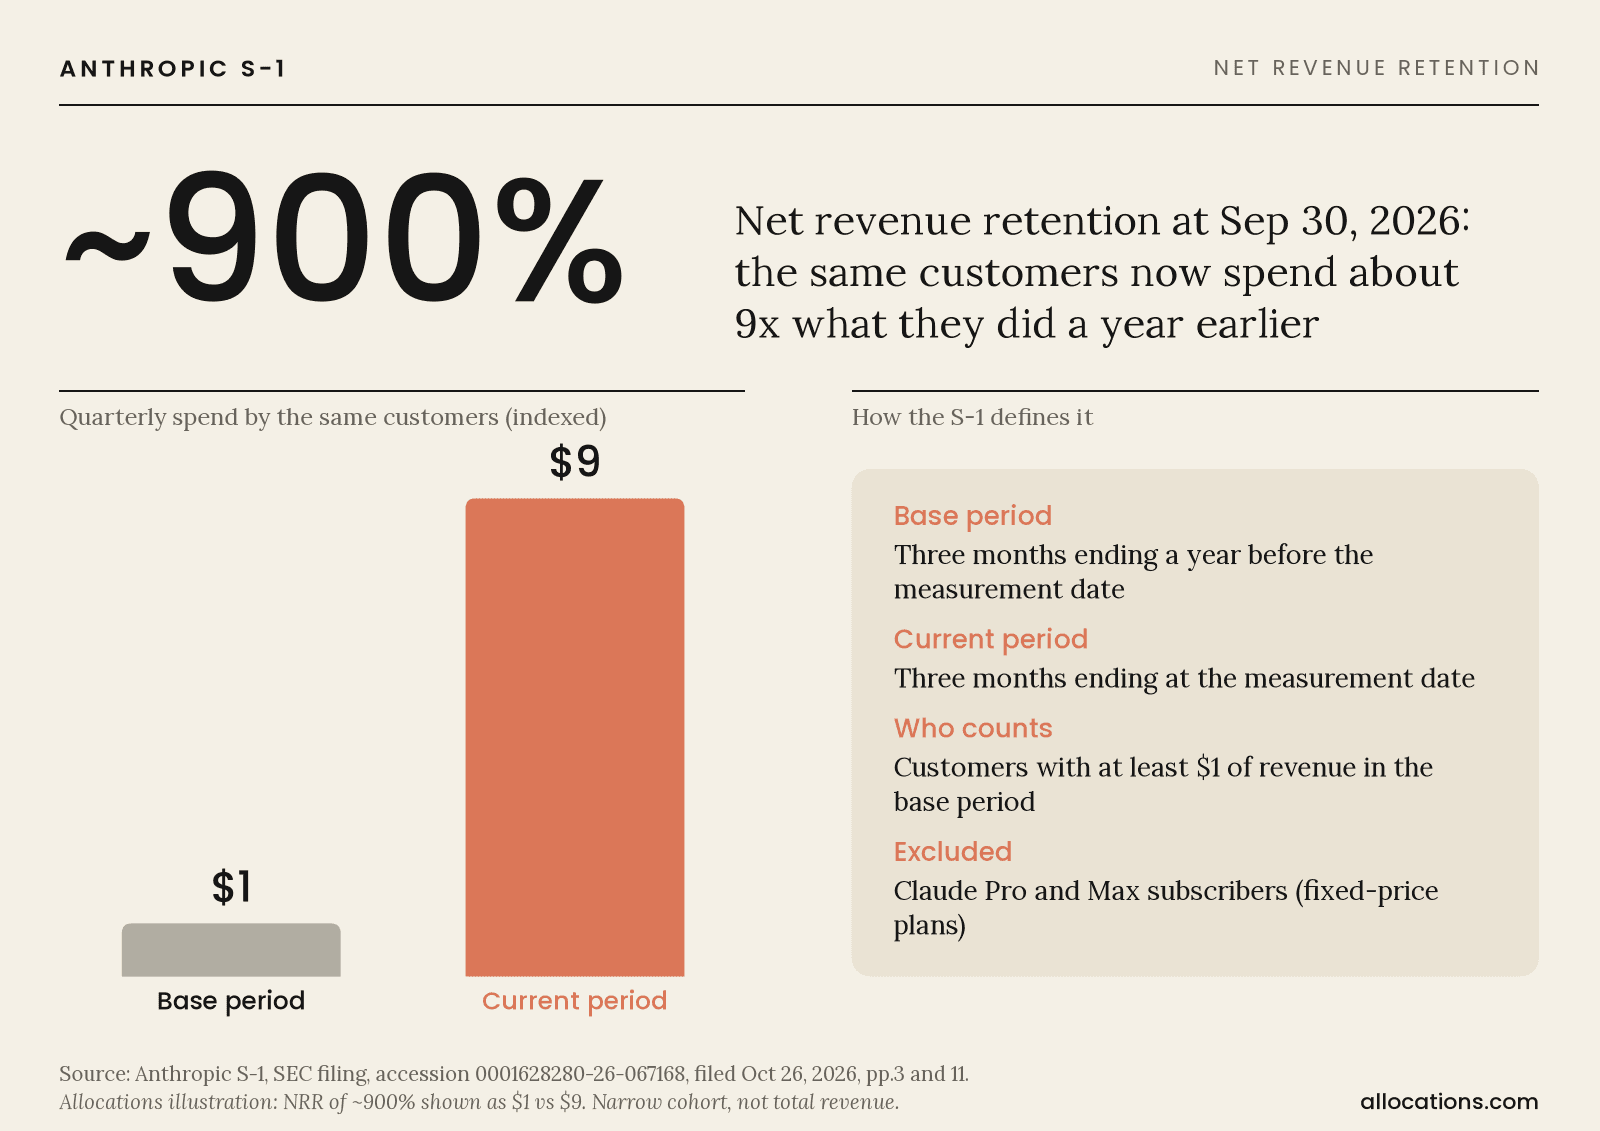
Source: Anthropic S-1 (SEC filing, accession 0001628280-26-067168), pp. 3 and 11; the $1 vs $9 illustration is our calculation; chart by Allocations

Source: Anthropic S-1 (SEC filing, accession 0001628280-26-067168), p. 9; company-reported key metrics; chart by Allocations
Date | Customers with $100K+ trailing-twelve-month revenue |
|---|---|
June 30, 2025 | More than 600 |
September 30, 2025 | More than 950 |
June 30, 2026 | More than 6,000 |
September 30, 2026 | More than 11,900 |
Sources: pp. 9, 149, 195. As of September 30, 2026 the filing also lists more than 1,900 customers at $1 million or more and approximately 250 at $10 million or more (pp. 9–10). These counts are company-reported key metrics. The filing does not describe independent verification of them.
Usage-based vs subscription revenue, and revenue per employee
Revenue is mostly consumption-based. In the six months ended June 30, 2026, usage-based revenue was $13.1 billion, or 80%, and subscription revenue was $3.2 billion, or 20% (p. 139). For full-year 2025 the split was $3.8 billion (83%) and $789 million (17%); for 2024 it was $288 million (75%) and $98 million (25%) (p. 139).
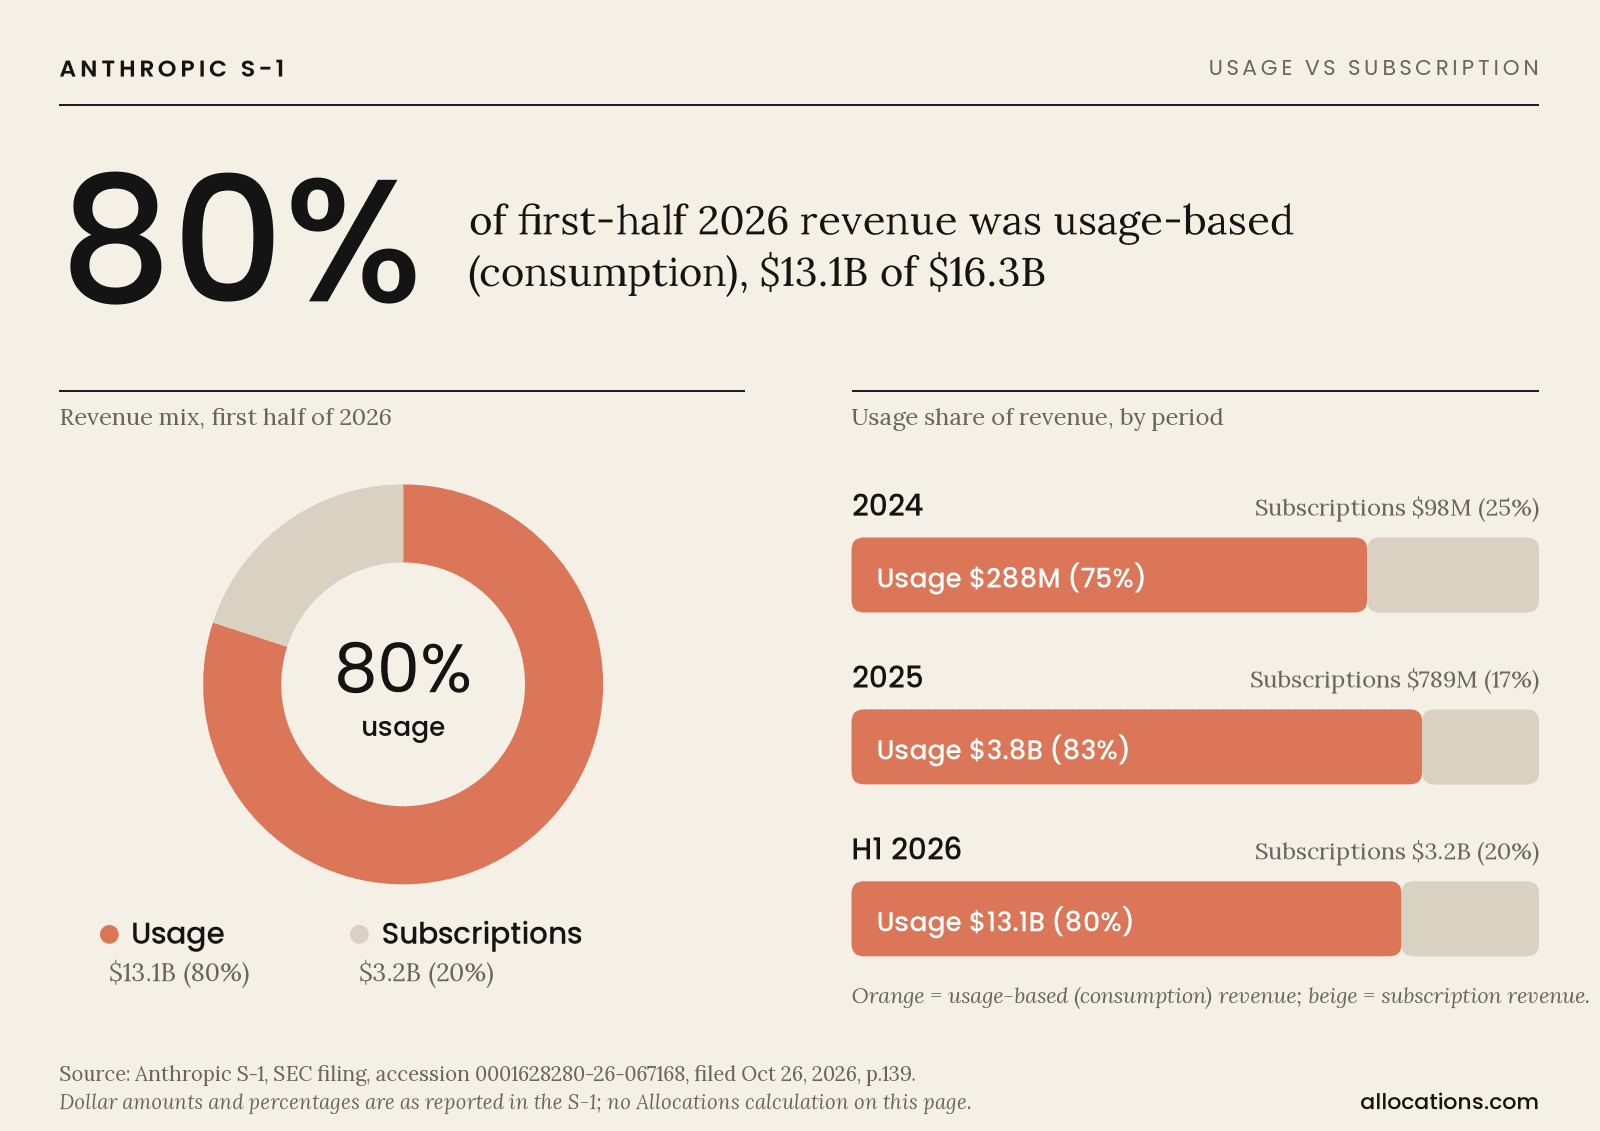
Source: Anthropic S-1 (SEC filing, accession 0001628280-26-067168), p. 139; chart by Allocations
Trailing-twelve-month revenue per employee rose from $1.4 million to more than $6.6 million between September 30, 2025 and September 30, 2026. Over that period revenue rose about 1,200% and headcount about 170% (p. 137).
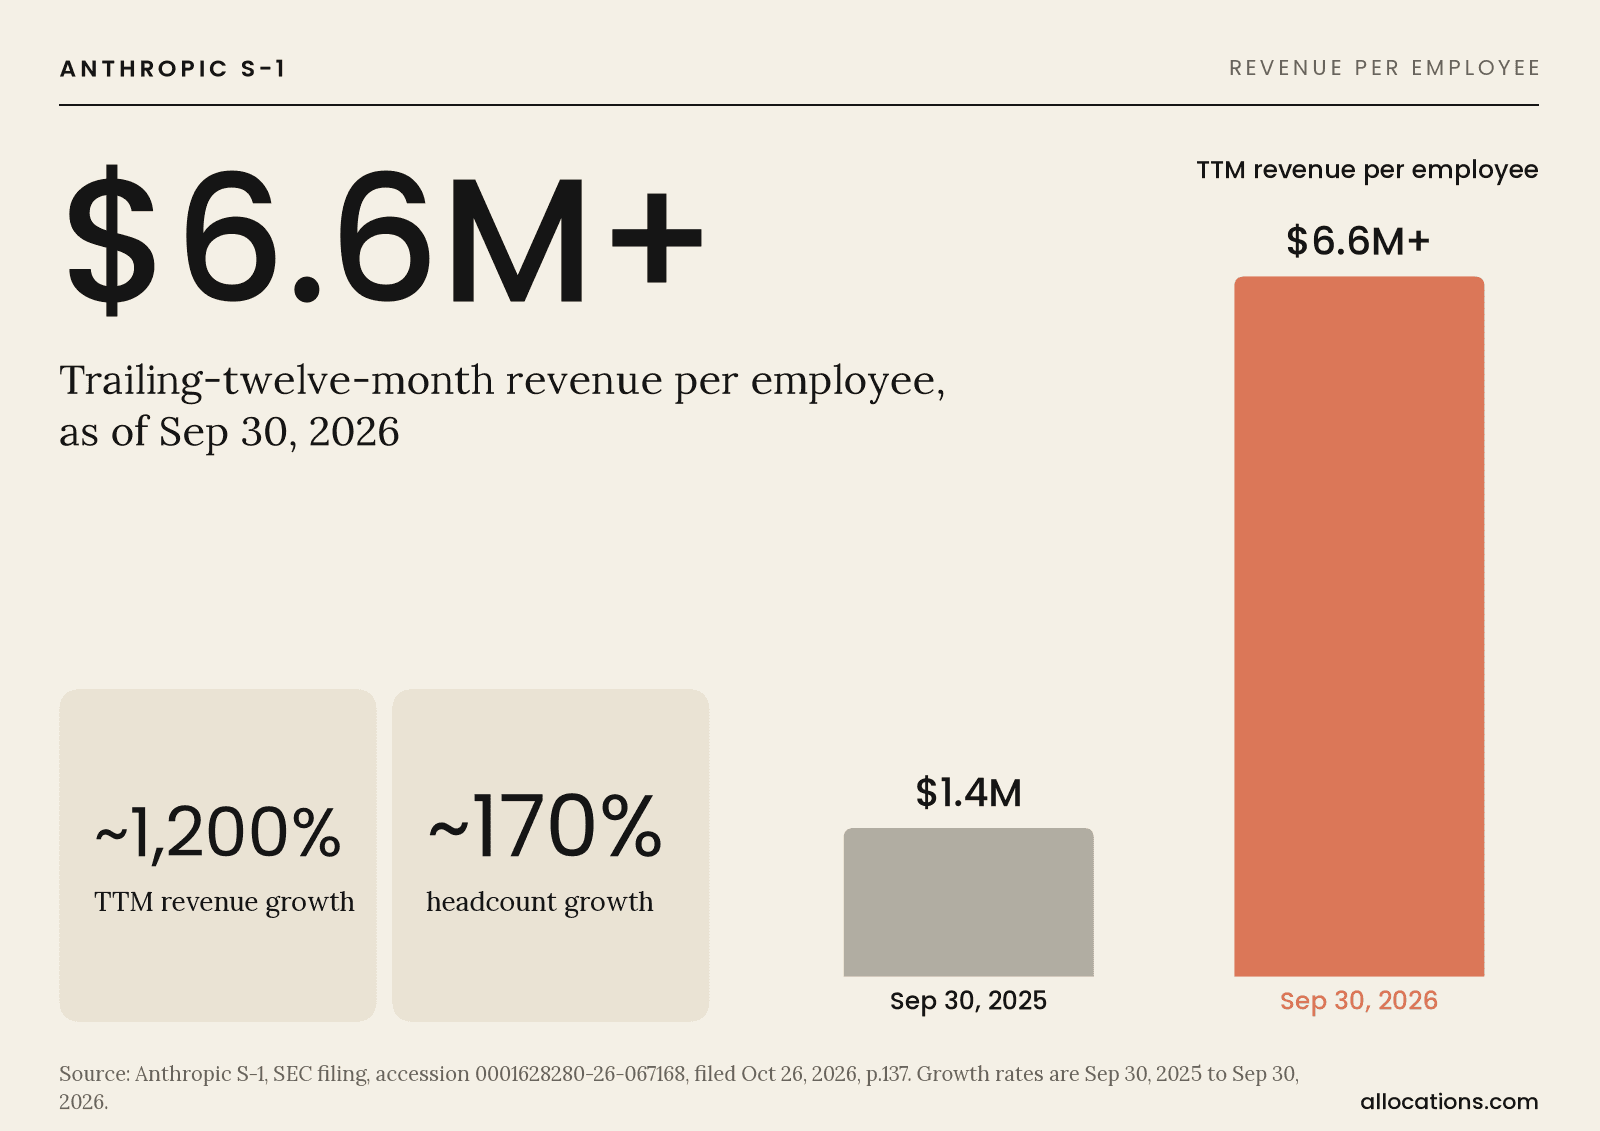
Source: Anthropic S-1 (SEC filing, accession 0001628280-26-067168), p. 137; company-reported key metrics; chart by Allocations
Compute commitments named in the S-1
Compute is also the largest commitment. The filing lists the major agreements on pp. 171–172. The table shows the seven we found with a stated dollar amount. The terms differ, and the filing does not give a single combined total, so the sum below is our addition and should not be quoted as an S-1 figure.
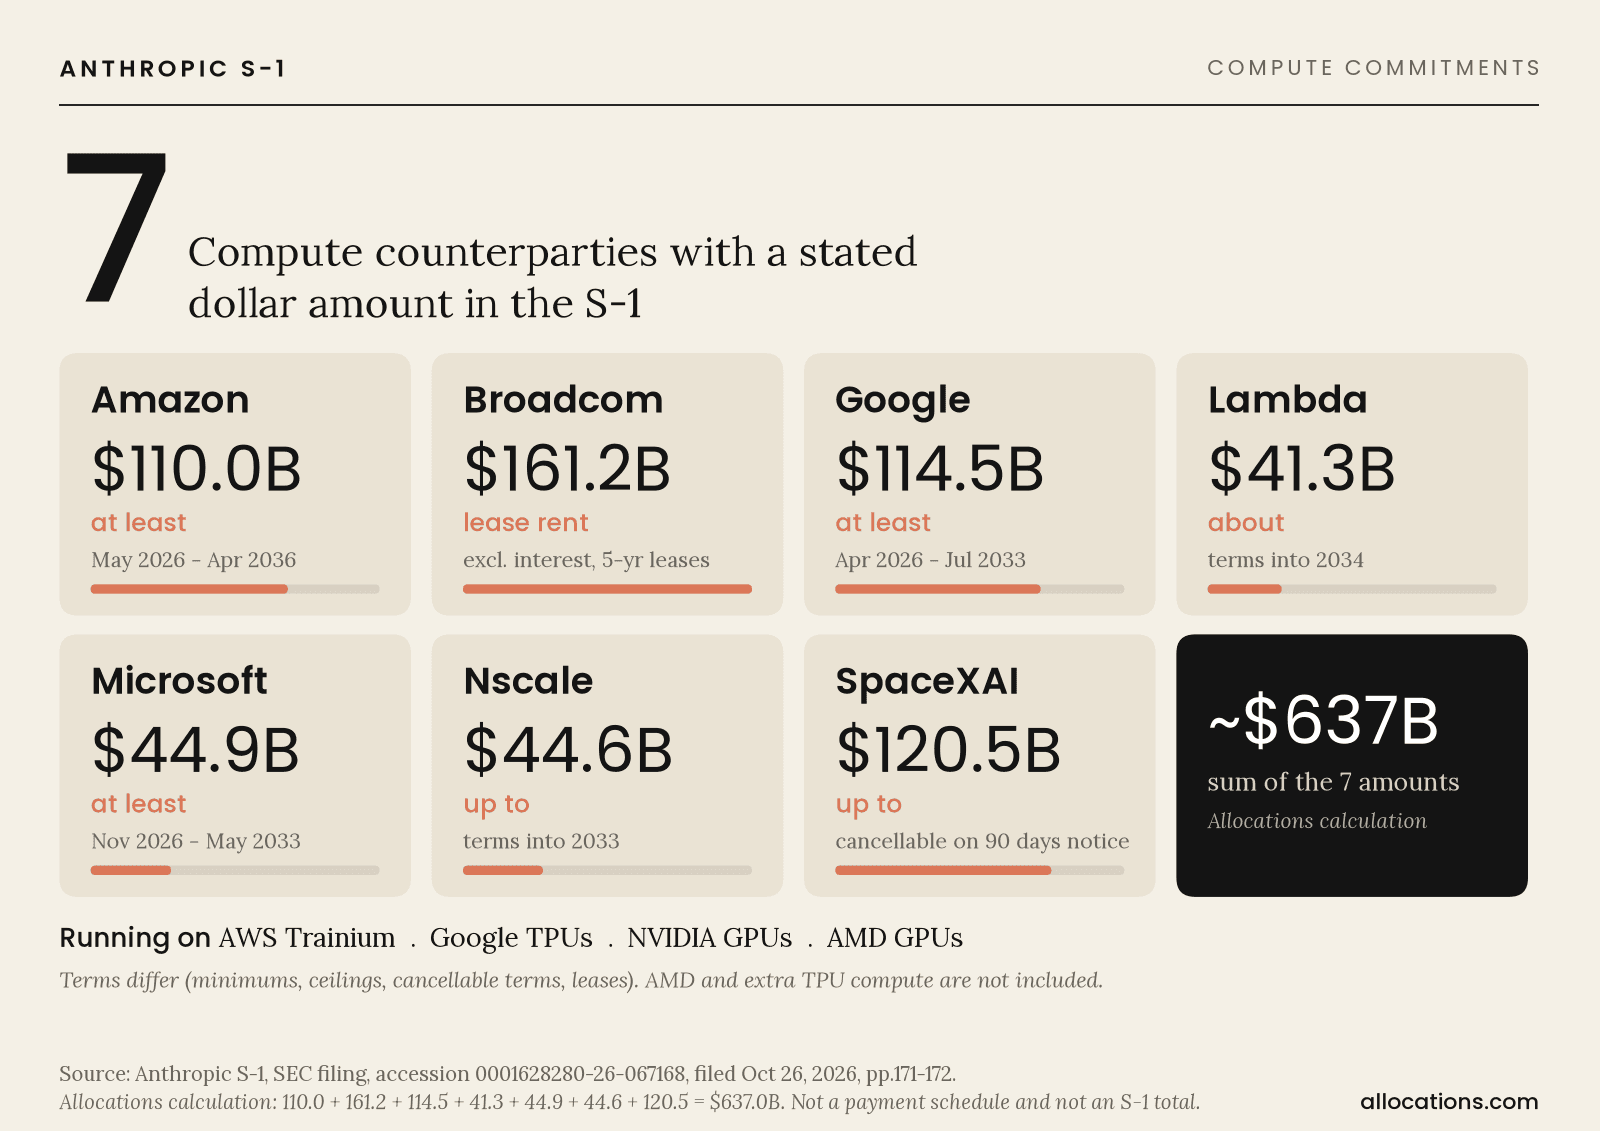
Source: Anthropic S-1 (SEC filing, accession 0001628280-26-067168), pp. 171-172; the $637B sum is our arithmetic, mixes minimums, ceilings, cancellable terms and leases, and is not an S-1 total; chart by Allocations
Counterparty | Stated amount | Notes from the filing |
|---|---|---|
Microsoft | At least $44.9B | Nov 2026 to May 2033, regardless of actual usage; non-cancellable except breach |
At least about $114.5B | Apr 2026 to Jul 2033, regardless of actual usage; shortfall paid as a true-up | |
Amazon | At least $110.0B | May 2026 to Apr 2036, regardless of actual usage; shortfall paid as a true-up |
SpaceXAI | Up to $120.5B | Cancellable by either party on 90 days' notice after initial non-cancellable periods |
Nscale | Up to about $44.6B | Terms into 2033; fees accrue only as capacity is delivered and accepted |
Lambda | About $41.3B | Terms into 2034; fees accrue only as capacity is delivered and accepted |
Broadcom | About $161.2B | Five-year master equipment leases (finance leases); rent excluding interest |
Sum of the seven (our arithmetic) | $637.0B | 44.9 + 114.5 + 110.0 + 120.5 + 44.6 + 41.3 + 161.2 |
This sum mixes minimums, ceilings, cancellable terms and leases over different periods. It shows the order of magnitude of the commitments, not a firm payment schedule. The filing also describes an AMD hardware agreement (expected spending above $20.0 billion) and additional TPU compute (estimated $125.0 billion to $150.0 billion, delivered 2028 to 2031). It states that both are not included in its contractual commitments table, and we left them out of the sum too. Read pp. 171–172 in full.
What the filing leaves blank: price range, share count, lock-up
The prospectus is preliminary and “subject to completion.” The proposed Nasdaq symbol is “ANT,” but the price range and number of shares offered are blank, so the filing contains no IPO price or valuation. Revenue for the three months ended September 30, 2026 is also left blank in the filing text, so the tables above stop at Q2 2026. Twenty-two underwriters are named, with Goldman Sachs and Morgan Stanley as representatives (p. 317). Lock-up terms are in the “Shares Eligible for Future Sale” and “Underwriting” sections (p. 118); read them in the filing, because the terms are specific and the document is a draft that may be amended.
If you're an Anthropic shareholder or employee, the lock-up and transfer terms in the filing are the ones that apply to you, and your own agreements and counsel come before any general guide. For general background, see our explainer on how pre-IPO stock works, our cap table and share class overview (published before this filing) and our 2026 IPO research page.
Frequently asked questions
What was Anthropic's quarterly revenue in Q2 2026?
$11,555 million, according to the quarterly results table in the S-1 (p. 158). Q1 2025 was $376 million.
How fast has Anthropic's quarterly revenue grown?
From $376 million in Q1 2025 to $11,555 million in Q2 2026 is about 30.7 times in five quarters (15 months). Year over year, Q2 2026 was about 14.7 times Q2 2025.
Is Anthropic profitable?
On a GAAP operating basis, Q2 2026 showed operating income of $974 million, but the six months ended June 30, 2026 were an operating loss of $693 million. Net loss was $66.3 billion for Q2 and $80.7 billion for the six months, driven mainly by fair-value changes on notes, derivatives and SAFEs (pp. 147, 148, 158).
What does revenue per dollar of compute mean?
It is revenue divided by compute and infrastructure expense. By our calculation from the S-1 it rose from $0.40 in Q1 2025 to $2.08 in Q2 2026. It is not a gross margin.
What is Anthropic's net revenue retention?
Approximately 900% as of September 30, 2026, per the S-1 (p. 11). The filing defines the cohort and excludes Pro and Max subscribers (p. 3).
Has the Anthropic IPO price been set?
No. The S-1 is a preliminary prospectus and leaves the price range and number of shares blank.
Where is the lock-up period described?
In the S-1's sections on shares eligible for future sale and underwriting (p. 118). Terms can change if the filing is amended.
Disclaimer: this article is general information based on a preliminary SEC filing. It is not investment advice, and it is not an offer to sell or a solicitation of an offer to buy any security. The S-1 is subject to completion and may be amended. Figures are from Anthropic, PBC's Form S-1 filed October 26, 2026, and any calculation marked as ours is our own arithmetic.
Short answer: Anthropic's S-1 reports quarterly revenue of $376 million in Q1 2025 and $11,555 million in Q2 2026, about 30.7 times higher in five quarters. Revenue per dollar of compute expense rose from $0.40 to $2.08 over the same period. Anthropic reported a GAAP operating income of $974 million in Q2 2026, but a six-month operating loss of $693 million and a net loss of $66.3 billion for the quarter.
Anthropic, PBC filed its Form S-1 with the SEC on October 26, 2026 (accession 0001628280-26-067168). It is a preliminary prospectus marked “subject to completion,” and the price range and share count are blank. Every figure below comes from that filing, with S-1 page numbers in parentheses. Where a number is our own arithmetic on the filing's numbers, we say so. You can read the filing yourself on SEC EDGAR.
For the IPO process, see our IPO timeline. This piece stays on the financials.
Anthropic quarterly revenue: $376M to $11,555M
The filing's quarterly results table (p. 158) gives six quarters. Quarterly figures in the S-1 are unaudited.
Source: Anthropic S-1 (SEC filing, accession 0001628280-26-067168), pp. 137 and 158; quarterly figures are unaudited; multiples are our calculation; chart by Allocations
Quarter | Revenue ($M) | Growth vs prior quarter |
|---|---|---|
Q1 2025 | 376 | n/a |
Q2 2025 | 787 | 2.1x |
Q3 2025 | 1,382 | 1.8x |
Q4 2025 | 2,040 | 1.5x |
Q1 2026 | 4,731 | 2.3x |
Q2 2026 | 11,555 | 2.4x |
Growth multiples are our calculation (for example 11,555 / 4,731 = 2.44). The four 2025 quarters add up to $4,585 million, which matches the 2025 annual revenue in the filing (p. 23). Annual revenue was $41 million in 2023 and $386 million in 2024 (p. 23).
Operating expenses grew much more slowly than revenue. Total operating expenses were $1,311 million in Q1 2025 and $10,581 million in Q2 2026 (p. 158), up about 8.1 times (10,581 / 1,311) against 30.7 times for revenue. Revenue minus operating expenses is operating income, so that gap is what moved the operating line from a $1,667 million loss in Q1 2026 to a $974 million gain in Q2 2026.
The 30x claim, with the arithmetic
Q1 2025 to Q2 2026 is five quarters, or 15 months. $11,555M / $376M = 30.7. So “about 30x in 15 months” holds, and it is slightly conservative. Year over year, Q2 2026 revenue is 11,555 / 787 = 14.7 times Q2 2025, which the filing describes as a 1,368% increase (p. 11).
The “every 3 days” claim
Q2 2026 has 91 days (30 in April, 31 in May, 30 in June). $11,555M / 91 = about $127M per day. Three days is about $381M, within 1.3% of Q1 2025's full-quarter revenue of $376M. The claim holds as a rounded comparison. It is a derived figure, not a statement in the filing.
Revenue per dollar of compute: $0.40 to $2.08
Compute and infrastructure is the largest expense line in the filing. Dividing quarterly revenue by that line gives a rough efficiency ratio. The S-1 does not publish this ratio; the table below is our calculation from p. 158.
Source: Anthropic S-1 (SEC filing, accession 0001628280-26-067168), p. 158; the ratio is our calculation (revenue divided by compute and infrastructure expense) and excludes other costs; chart by Allocations
Quarter | Revenue ($M) | Compute & infrastructure ($M) | Revenue per $1 of compute |
|---|---|---|---|
Q1 2025 | 376 | 944 | $0.40 |
Q2 2025 | 787 | 1,390 | $0.57 |
Q3 2025 | 1,382 | 2,047 | $0.68 |
Q4 2025 | 2,040 | 2,945 | $0.69 |
Q1 2026 | 4,731 | 3,387 | $1.40 |
Q2 2026 | 11,555 | 5,558 | $2.08 |
$2.08 / $0.40 = 5.2, so “more than 5x” holds. In Q2 2026, revenue grew 1,368% year over year while compute and infrastructure expense grew about 300% (pp. 11, 137).
Read this ratio with care. It leaves out personnel, sales, research and other costs, so it is not a gross margin. The company also warns that new compute is expensed as it comes online, often ahead of the revenue it will support, and that operating margin may compress in those periods (p. 134). One strong quarter does not make a trend line.
Is Anthropic profitable? Operating income vs net loss
Both of these are true in the filing: Anthropic had a positive GAAP operating income in Q2 2026, and it had a large net loss in the same quarter. They measure different things.
Source: Anthropic S-1 (SEC filing, accession 0001628280-26-067168), p. 158 (quarterly, unaudited); chart by Allocations
Metric ($M) | Q2 2026 | Six months ended June 30, 2026 |
|---|---|---|
Revenue | 11,555 | 16,286 |
Operating income (loss) | 974 | (693) |
Change in fair value of notes, derivatives and SAFEs | (59,597) | (72,388) |
Net loss | (66,309) | (80,748) |
Sources: quarterly table p. 158; six-month figures pp. 23 and 148. Q2 2026 operating income of $974M on $11,555M of revenue is an operating margin of 8.4% (our calculation).
The gap between operating income and net loss is mostly one line. The filing records its convertible notes, derivative liabilities and SAFEs at fair value each period. Because they are marked to market, increases in the company's enterprise valuation drive increases in this expense (p. 147). It is an accounting remeasurement, separate from running costs.
Two more numbers matter for the profitability question. The filing's non-GAAP Adjusted Operating Income, which excludes stock-based compensation, non-cash charitable contributions and the Bartz settlement, was $1,618 million for the six months, a 10% margin (pp. 25, 156–157). Operating cash flow for the six months was positive $3.9 billion (p. 169). So the accurate summary is: operating income positive in one quarter, negative over the half year, net loss in every period shown.
The Bartz settlement was $1.5 billion and sits in Q3 2025, which is why that quarter's operating loss of $3,089 million stands out in the table.
Net revenue retention and $100K+ customers
The filing reports net revenue retention of approximately 900% as of September 30, 2026 (p. 11). The definition is narrow: it compares current-quarter revenue from customers who generated at least $1 in the base period a year earlier, and it excludes Pro and Max subscribers (p. 3). A very low starting threshold and a small early base make a number like this large. Treat it as a measure of expansion among that cohort, not of the whole business.
Source: Anthropic S-1 (SEC filing, accession 0001628280-26-067168), pp. 3 and 11; the $1 vs $9 illustration is our calculation; chart by Allocations
Source: Anthropic S-1 (SEC filing, accession 0001628280-26-067168), p. 9; company-reported key metrics; chart by Allocations
Date | Customers with $100K+ trailing-twelve-month revenue |
|---|---|
June 30, 2025 | More than 600 |
September 30, 2025 | More than 950 |
June 30, 2026 | More than 6,000 |
September 30, 2026 | More than 11,900 |
Sources: pp. 9, 149, 195. As of September 30, 2026 the filing also lists more than 1,900 customers at $1 million or more and approximately 250 at $10 million or more (pp. 9–10). These counts are company-reported key metrics. The filing does not describe independent verification of them.
Usage-based vs subscription revenue, and revenue per employee
Revenue is mostly consumption-based. In the six months ended June 30, 2026, usage-based revenue was $13.1 billion, or 80%, and subscription revenue was $3.2 billion, or 20% (p. 139). For full-year 2025 the split was $3.8 billion (83%) and $789 million (17%); for 2024 it was $288 million (75%) and $98 million (25%) (p. 139).
Source: Anthropic S-1 (SEC filing, accession 0001628280-26-067168), p. 139; chart by Allocations
Trailing-twelve-month revenue per employee rose from $1.4 million to more than $6.6 million between September 30, 2025 and September 30, 2026. Over that period revenue rose about 1,200% and headcount about 170% (p. 137).
Source: Anthropic S-1 (SEC filing, accession 0001628280-26-067168), p. 137; company-reported key metrics; chart by Allocations
Compute commitments named in the S-1
Compute is also the largest commitment. The filing lists the major agreements on pp. 171–172. The table shows the seven we found with a stated dollar amount. The terms differ, and the filing does not give a single combined total, so the sum below is our addition and should not be quoted as an S-1 figure.
Source: Anthropic S-1 (SEC filing, accession 0001628280-26-067168), pp. 171-172; the $637B sum is our arithmetic, mixes minimums, ceilings, cancellable terms and leases, and is not an S-1 total; chart by Allocations
Counterparty | Stated amount | Notes from the filing |
|---|---|---|
Microsoft | At least $44.9B | Nov 2026 to May 2033, regardless of actual usage; non-cancellable except breach |
At least about $114.5B | Apr 2026 to Jul 2033, regardless of actual usage; shortfall paid as a true-up | |
Amazon | At least $110.0B | May 2026 to Apr 2036, regardless of actual usage; shortfall paid as a true-up |
SpaceXAI | Up to $120.5B | Cancellable by either party on 90 days' notice after initial non-cancellable periods |
Nscale | Up to about $44.6B | Terms into 2033; fees accrue only as capacity is delivered and accepted |
Lambda | About $41.3B | Terms into 2034; fees accrue only as capacity is delivered and accepted |
Broadcom | About $161.2B | Five-year master equipment leases (finance leases); rent excluding interest |
Sum of the seven (our arithmetic) | $637.0B | 44.9 + 114.5 + 110.0 + 120.5 + 44.6 + 41.3 + 161.2 |
This sum mixes minimums, ceilings, cancellable terms and leases over different periods. It shows the order of magnitude of the commitments, not a firm payment schedule. The filing also describes an AMD hardware agreement (expected spending above $20.0 billion) and additional TPU compute (estimated $125.0 billion to $150.0 billion, delivered 2028 to 2031). It states that both are not included in its contractual commitments table, and we left them out of the sum too. Read pp. 171–172 in full.
What the filing leaves blank: price range, share count, lock-up
The prospectus is preliminary and “subject to completion.” The proposed Nasdaq symbol is “ANT,” but the price range and number of shares offered are blank, so the filing contains no IPO price or valuation. Revenue for the three months ended September 30, 2026 is also left blank in the filing text, so the tables above stop at Q2 2026. Twenty-two underwriters are named, with Goldman Sachs and Morgan Stanley as representatives (p. 317). Lock-up terms are in the “Shares Eligible for Future Sale” and “Underwriting” sections (p. 118); read them in the filing, because the terms are specific and the document is a draft that may be amended.
If you're an Anthropic shareholder or employee, the lock-up and transfer terms in the filing are the ones that apply to you, and your own agreements and counsel come before any general guide. For general background, see our explainer on how pre-IPO stock works, our cap table and share class overview (published before this filing) and our 2026 IPO research page.
Frequently asked questions
What was Anthropic's quarterly revenue in Q2 2026?
$11,555 million, according to the quarterly results table in the S-1 (p. 158). Q1 2025 was $376 million.
How fast has Anthropic's quarterly revenue grown?
From $376 million in Q1 2025 to $11,555 million in Q2 2026 is about 30.7 times in five quarters (15 months). Year over year, Q2 2026 was about 14.7 times Q2 2025.
Is Anthropic profitable?
On a GAAP operating basis, Q2 2026 showed operating income of $974 million, but the six months ended June 30, 2026 were an operating loss of $693 million. Net loss was $66.3 billion for Q2 and $80.7 billion for the six months, driven mainly by fair-value changes on notes, derivatives and SAFEs (pp. 147, 148, 158).
What does revenue per dollar of compute mean?
It is revenue divided by compute and infrastructure expense. By our calculation from the S-1 it rose from $0.40 in Q1 2025 to $2.08 in Q2 2026. It is not a gross margin.
What is Anthropic's net revenue retention?
Approximately 900% as of September 30, 2026, per the S-1 (p. 11). The filing defines the cohort and excludes Pro and Max subscribers (p. 3).
Has the Anthropic IPO price been set?
No. The S-1 is a preliminary prospectus and leaves the price range and number of shares blank.
Where is the lock-up period described?
In the S-1's sections on shares eligible for future sale and underwriting (p. 118). Terms can change if the filing is amended.
Disclaimer: this article is general information based on a preliminary SEC filing. It is not investment advice, and it is not an offer to sell or a solicitation of an offer to buy any security. The S-1 is subject to completion and may be amended. Figures are from Anthropic, PBC's Form S-1 filed October 26, 2026, and any calculation marked as ours is our own arithmetic.

Addhyan Negi
Director of Marketing, Allocations

Start your next SPV
in 10 minutes
Start your next SPV in 10 minutes
Start your next SPV
in 10 minutes
Read related articles
Allocations secondary market is operated through Allocations Securities, LLC dba AllocationsX, member FINRA/SIPC. Check this firm on FINRA BrokerCheck. Allocations Securities, LLC is a wholly owned subsidiary of Allocations, Inc.
Copyright © Allocations Inc
Allocations secondary market is operated through Allocations Securities, LLC dba AllocationsX, member FINRA/SIPC. Check this firm on FINRA BrokerCheck. Allocations Securities, LLC is a wholly owned subsidiary of Allocations, Inc.
Copyright © Allocations Inc
Allocations secondary market is operated through Allocations Securities, LLC dba AllocationsX, member FINRA/SIPC. Check this firm on FINRA BrokerCheck. Allocations Securities, LLC is a wholly owned subsidiary of Allocations, Inc.
Copyright © Allocations Inc